Action! But wait, loading first.Loading... because remakes need time too.From classics to modern hits, we're on it.Directing your data story, scene by scene.
Please be patient, this may take a little bit long.
Unveiling Trends in Movie Remakes
A look into trends, success stories, and the evolution of remade films.
You are a film director working for a well-known company - “Lausanne pictures”. It’s been a while since
you shot your last movie that took people’s breaths away and you wish to get back into the spotlight
without “dropping the ball”. But …. you are out of original ideas. “What if I take an already existing
storyline but make it bigger, better?”, you think to yourself. “But then, what movie should I choose to
reenact so that success is inevitable?”. Tough question. And here is where our team comes to assist you.
MADAYAM is about to unravel the MAD secrets of the remake industry "which movie should you remake? Will
your remake match or even surpass the success of the original? What characteristics of a movie increase
its likelihood of being remade?" - these are the questions we will answer for you based on the data
across years of evolution and development of film industry. Are you ready for the most comprehensive
analysis involving the most popular movie datasets?
Meet Our Team
(randomized order)
Aryan Ahadinia
Master in Computer Science
Amirmahdi Hosseinabadi
Master in Financial Engineering
Matin Ansaripour
Master in Computer Science
Sabri Yigit Arslan
Master in Computer Science
Maria Yuffa
Master in Neuro-X
The Data
First, to provide you with the most accurate advice on which movies to remake, we need access to the
best
and most comprehensive data. Unfortunately, no single dataset offers a complete picture of the film
industry. Therefore, we’ve combined several datasets, carefully merging and cleaning them to ensure the
analysis is both robust and reliable. No single source can provide all the information we need, so we’ve
combined data from the CMU Movie Corpus, TMDB, IMDb, and Wikipedia to create a comprehensive dataset
that
covers a wide range of movie-related information. Each of the features in our dataset has been carefully
selected from one dataset and enriched with data from other sources to create the best possible dataset
for
our analysis. Figure below shows the sources and their contribution to each feature in our dataset.
Continuous lines mean the main source of the data and dashed lines are complementary sources which have
been used to enrich the dataset.
Hover on the Columns or Sources.
CMU Movie Corpus
TMDB
IMDb
information.
Wikipedia
Name 📇
Title of the Movie
Genre 🍿
The date when the movie was
released.
Year 𝟚𝟘𝟚𝟜
The release date of the
movie.
Type 🅾️🅰️🅱️
Whether is this a regular,
short, or ...
movie.
Country 🇨🇭
The origin of the movie.
Lang ㍻
The language of the movie.
Runtime ⏱️
The duration of a movie.
Budget 💵
The budget expended for the
production.
Rev. 🤑
The revenue of the movie.
Votes 🗳️
The number and average votes of
people for the
movie.
Crew ✨
The stars and crew of the movie.
Adult 🔞
If the movie is for adults only
Plot 🗺️
The summary of the plot.
Remake ♻️
Whether is the movie remade or
is a
reference
for a remake.
Adjusting Revenue and Budget for Fair Comparisons
In our dataset, all monetary values are reported in US dollars. However, movies are produced and released in different countries and across various time periods. To compare monetary features like budget and revenue between movies, it is essential to adjust these values to account for these variations.
Country Differences:
Cinema ticket prices and production costs vary significantly across countries. For instance, cinema tickets in Switzerland cost around 20 CHF, whereas in Italy, they are approximately 10 Euros. To fairly compare the revenue of Swiss and Italian movies, it is necessary to account for these differences. This adjustment is typically made using the Purchasing Power Parity (PPP) rate, a metric that adjusts for differences in price levels between countries. However, due to insufficient historical PPP data, we decided to omit country-specific adjustments in our analysis.
Inflation Adjustment:
Over time, prices and costs increase due to inflation. For example, a cinema ticket that cost $5 in the 2000s might now cost $10. To compare movies released in different time periods, we adjusted all monetary values using the US Consumer Price Index (CPI). The CPI measures changes in price levels over time and is defined as follows:
\[ CPI_t = \frac{\text{Cost of Market Basket in Year } t}{\text{Cost of Market Basket in Base Year}}
\times
100 \]
By applying CPI adjustments, we ensure that movie budgets and revenues are comparable across different years, allowing for a more accurate analysis.
Our dataset is publicly available on Kaggle for later analysis!
Remakes and Movies Through Chronus
Let’s dive deeper into the world of films and remakes. First, you might as a question “How many remakes have
been made throughout the filmographic history? Is there a difference in the number of films made across the
decades? How about remakes?” All of these are valid questions. And let me tell you, there is a difference.
While there are more remakes and more films made each year, the number of original movies are worth
re-capturing seems to decline. Well, at least you are not tricking yourself by choosing to re-shoot the film
instead of trying to aimlessly search for worthy new ideas. This is different with remakes and the whole
dataset: more movies are made - more remakes are produced. Cooking some statistics to see how close our
power law fits the log-log distributions, we observe that R2 metric for the whole dataset is 0.86 suggesting
that the fitted power law distribution explains the data well. This is not the case for the remakes and
originals with only 0.58 and 0.18 respectively.
It is important to note that a movie being shot before 1980 had a higher probability to be remade. This is a
good point! We don’t want the recreated movies to be based on the films released recently. We want to have
the nostalgic factor to appeal to our audience and make the movie a success!
Finally, we can notice that the mean number of remakes across the cinematic history is much more recent than
for the whole dataset. Understandably, before you shoot a remake you have to shoot an original.
How Long Should Our Creative Struggle Take? Or Runtimes
Well, ok, we have more remakes. But it is not about quantity but quality of those, mes amis, that we are
interested in. To start us off, we should constrain our movie to a reasonable time. Compared to the whole
dataset, there are not so many outliers and there is not a single remake exceeding 200 minutes.
People and Their Opinions
We want your movie to be great. But to know what “great” actually means, we first need to take a look at
what people’s opinions are on different movies, be it an original movie, a remake or any other. Let’s now
take a look at the trends in the vote scores.
As we would have predicted anyways, vote scores for originals are shifted to the right meaning that movies
that really resonated with the audience were chosen to be remade. This perfectly aligns with the regression
analysis since the vote average significantly affected the movie to be remade.
Rather surprisingly, the remakes didn’t seem to keep that sparkle and performed similarly to the rest of the
movies. Well, something to think about.
The remakes appeared to generate significant buzz, receiving a higher average number of votes compared to
the rest of the dataset. Interestingly, the originals maintained a slight edge in average votes over both
remakes and other films. This trend could suggest that fans of the original movies felt compelled to share
their opinions on the recreated versions of the beloved films.
Bombastic Genre Combo
Now, we’ve thought a lot about data generally and have made up our mind about some technicalities, but what
about the movie itself? Let’s think holistically for now and consider a possible genre combination between
the original movie and the remake.
Uff, some tenners do seem appealing. But despite the success of the combination, we should approach this
with some skepticism. Specifically, there might be only few votes for those compared to the ones with a
lower rating. Overall, it is not just about the score, it is also about the wide public reach and the urgent
need of the viewers to share their opinion. Plus, it is simply fairer when the votes are given by a variety
of people. This also applies to the case where there are more votes just because there are more movies. To
account for all that, we average the vote counts across movies and apply logarithm scaling to make the plot
descriptive. After checking the vote counts we see that for some genre combinations the value is indeed low.
This coincides with the tenners that we observe, tough luck. Hence, we multiply vote averages by the mean
logarithm of vote counts to get a better look.
Seems like you can’t really go wrong with Comedy, Mystery and World cinema.
You might ask, what genres were typically remade? The movies were likely to be recreated if their main genre
was Thriller, Romance or Comedy which constitutes one of the most prevalent genres. Hence, for an original
being either of those three was significant to being remade. That was also true for Black-and-White movies,
which is easy to explain, since Black-And-White movies are typically old movies (of course some
masterpieces) that were waiting for technological development to be shot in full glory. Therefore, going for
one of these options seems like a safe choice. Well, for now that seems fair.
Laughing or Crying? Hating or Loving? Sinking into Despair or Rising in Joy?
Genres are sorted, but what about the emotions we want to evoke in our viewers? This is where Large Language
Models (LLMs) step in to help. To analyze the sentiment of each movie, we utilize a BERT model alongside
plot summaries from our merged dataset. For shorter summaries within the model's input limit, we directly
perform sentiment analysis. For longer summaries, we first condense them using a Seq2Seq BERT model,
ensuring all plots are effectively analyzed.
Now, let’s go back to the analysis. Even though the sentiment labels for whole movie dataset are more or
less evenly split, when it comes to
remakes and originals there seems to be a prevalence of movies with sad or negative plots. Sad stories often
have a strong emotional core that can resonate deeply with audiences, providing a built-in emotional
investment and a higher potential for audience engagement. Due to nostalgic factor and emotional depth,
these movies might have higher commercial appeal to the audience. Nonetheless, looking at the data,
specifically vote averages, it seems that on average there was only 0.23% higher score for films with
negative sentiment. There were no remakes that had a drastically different plotline from the originals: all
of the sentiment labels for originals matched those of remakes. Overall, it is up to us to choose the
sentiment of the story.
All of these stats is interesting, but is sentiment label significant when it comes to predicting whether
the movie is a remake, or in other words, does it play a role in the remake? To answer this question we
perform regression analysis and indeed, sentiment of the movie affects the remakes. Specifically, the movies
with negative sentiment are likely to be a remake, hence the negative coefficient we observe in the plots
later. Sentiment, however, seems to have no effect on the movie being remade, meaning that whether we have a
happy or sad ending of the original story, whether it will be remade remains a mystery. To conclude our
brief analysis, it is up to us to choose an original, making the audience cry tears of sadness or joy.
Who Should We Invite to Star?
Now, you might start thinking, who should we invite to join our movie to make it truly splendid - an
impressive cast! For one, we should make sure our cast is diverse to maximize our monetary gains.
What about the actual ethnicities? How represented is the movie industry?
Despite higher revenues gained by movies with diverse nationalities and a lot of them represented in the
filmmaking industry likely appealing to wider public, when it comes to race the movie industry should
definitely do better..
Previously, remakes seem to have involved crews with huge fanbases, with the total popularity score across
movies higher than those of originals and other movies. However, despite doing so, as we’ve seen before the
vote average scores for remakes were similar to the average across all movies. So, should we invite a star
cast? This is something we will need to think about further when doing the regression analysis.
Movies with diverse nationalities achieve higher revenues, reflecting their appeal to a broad audience.
However, the stark racial imbalance in representation—dominated by "White" individuals—highlights the
industry's shortcomings in inclusively. To truly embrace diversity, the film industry and we as a part of
it, must prioritize equitable racial representation, not just nationality diversity, unlocking both ethical
and market potential.
Remakes tend to feature more prominent crews compared to originals and other movies, often involving
individuals with large fanbases. This is reflected in their higher total popularity scores of the crew.
Furthermore, higher popularity scores for the cast meant that the movie was more likely to be a remake.
However, despite this, the vote average for remakes remains similar to the overall movie average. Should we
rely on a star-studded cast? This is a question worth exploring further in our regression analysis.
Future Directions
Following our exploratory data analysis (EDA) and initial investigation into patterns and differences between movie remakes, originals, and other movies, we delve deeper into two key areas of analysis:
Comparison of Movie Originals vs. Their Remakes:
In this section, we take a closer look at how specific features of original movies differ from their remakes. By comparing attributes such as runtime, budget, revenue, and popularity, we aim to uncover the defining characteristics of remakes and understand the changes made to adapt these movies for modern audiences.
What Movie Should I Build From, and How Should I Make It?
Here, we shift focus to explore what makes a movie more likely to be remade and how certain features contribute to its potential success.
These sections build on our EDA findings, offering a deeper understanding of the remake industry and actionable insights for filmmakers and industry professionals.
Feature Comparison of Movie Originals vs. Their Remakes
While some remakes breathe new life into beloved classics, others struggle to capture the magic of their
predecessors. But beyond revenue and critical reviews, how do the key characteristics of remakes differ from
their originals? Our data-driven investigation seeks to answer this question by examining the underlying
features that define both versions of a film.
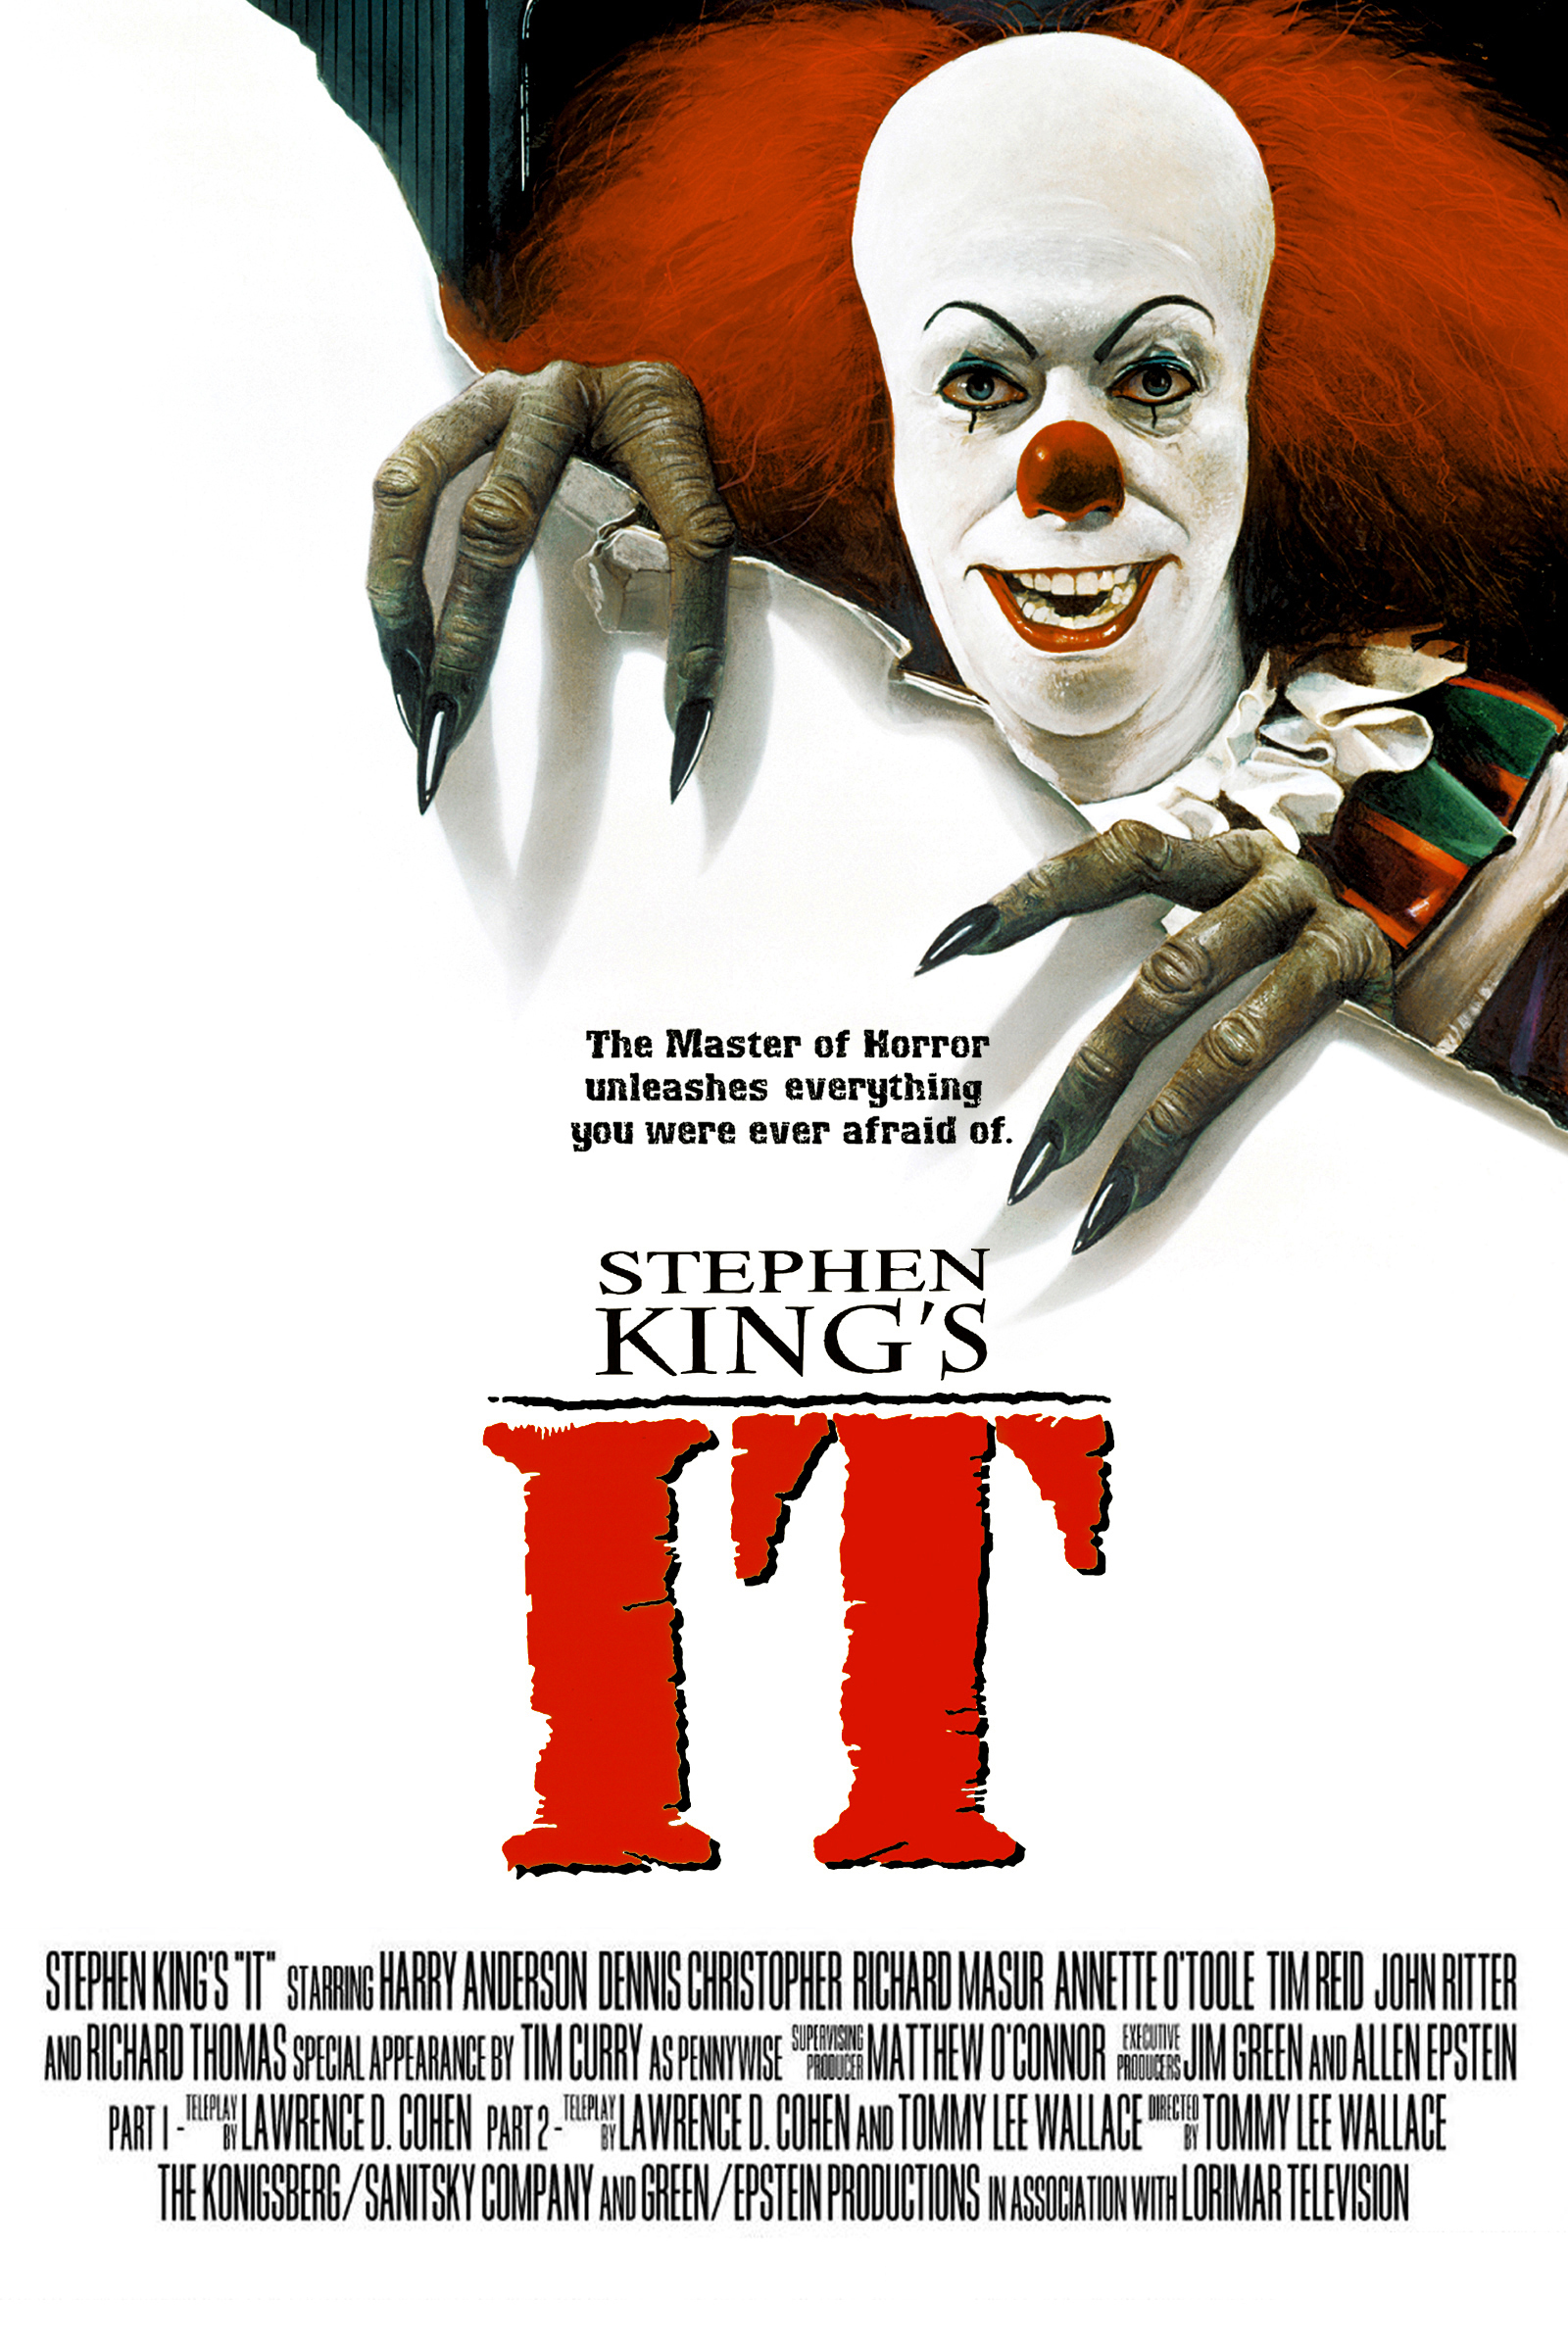
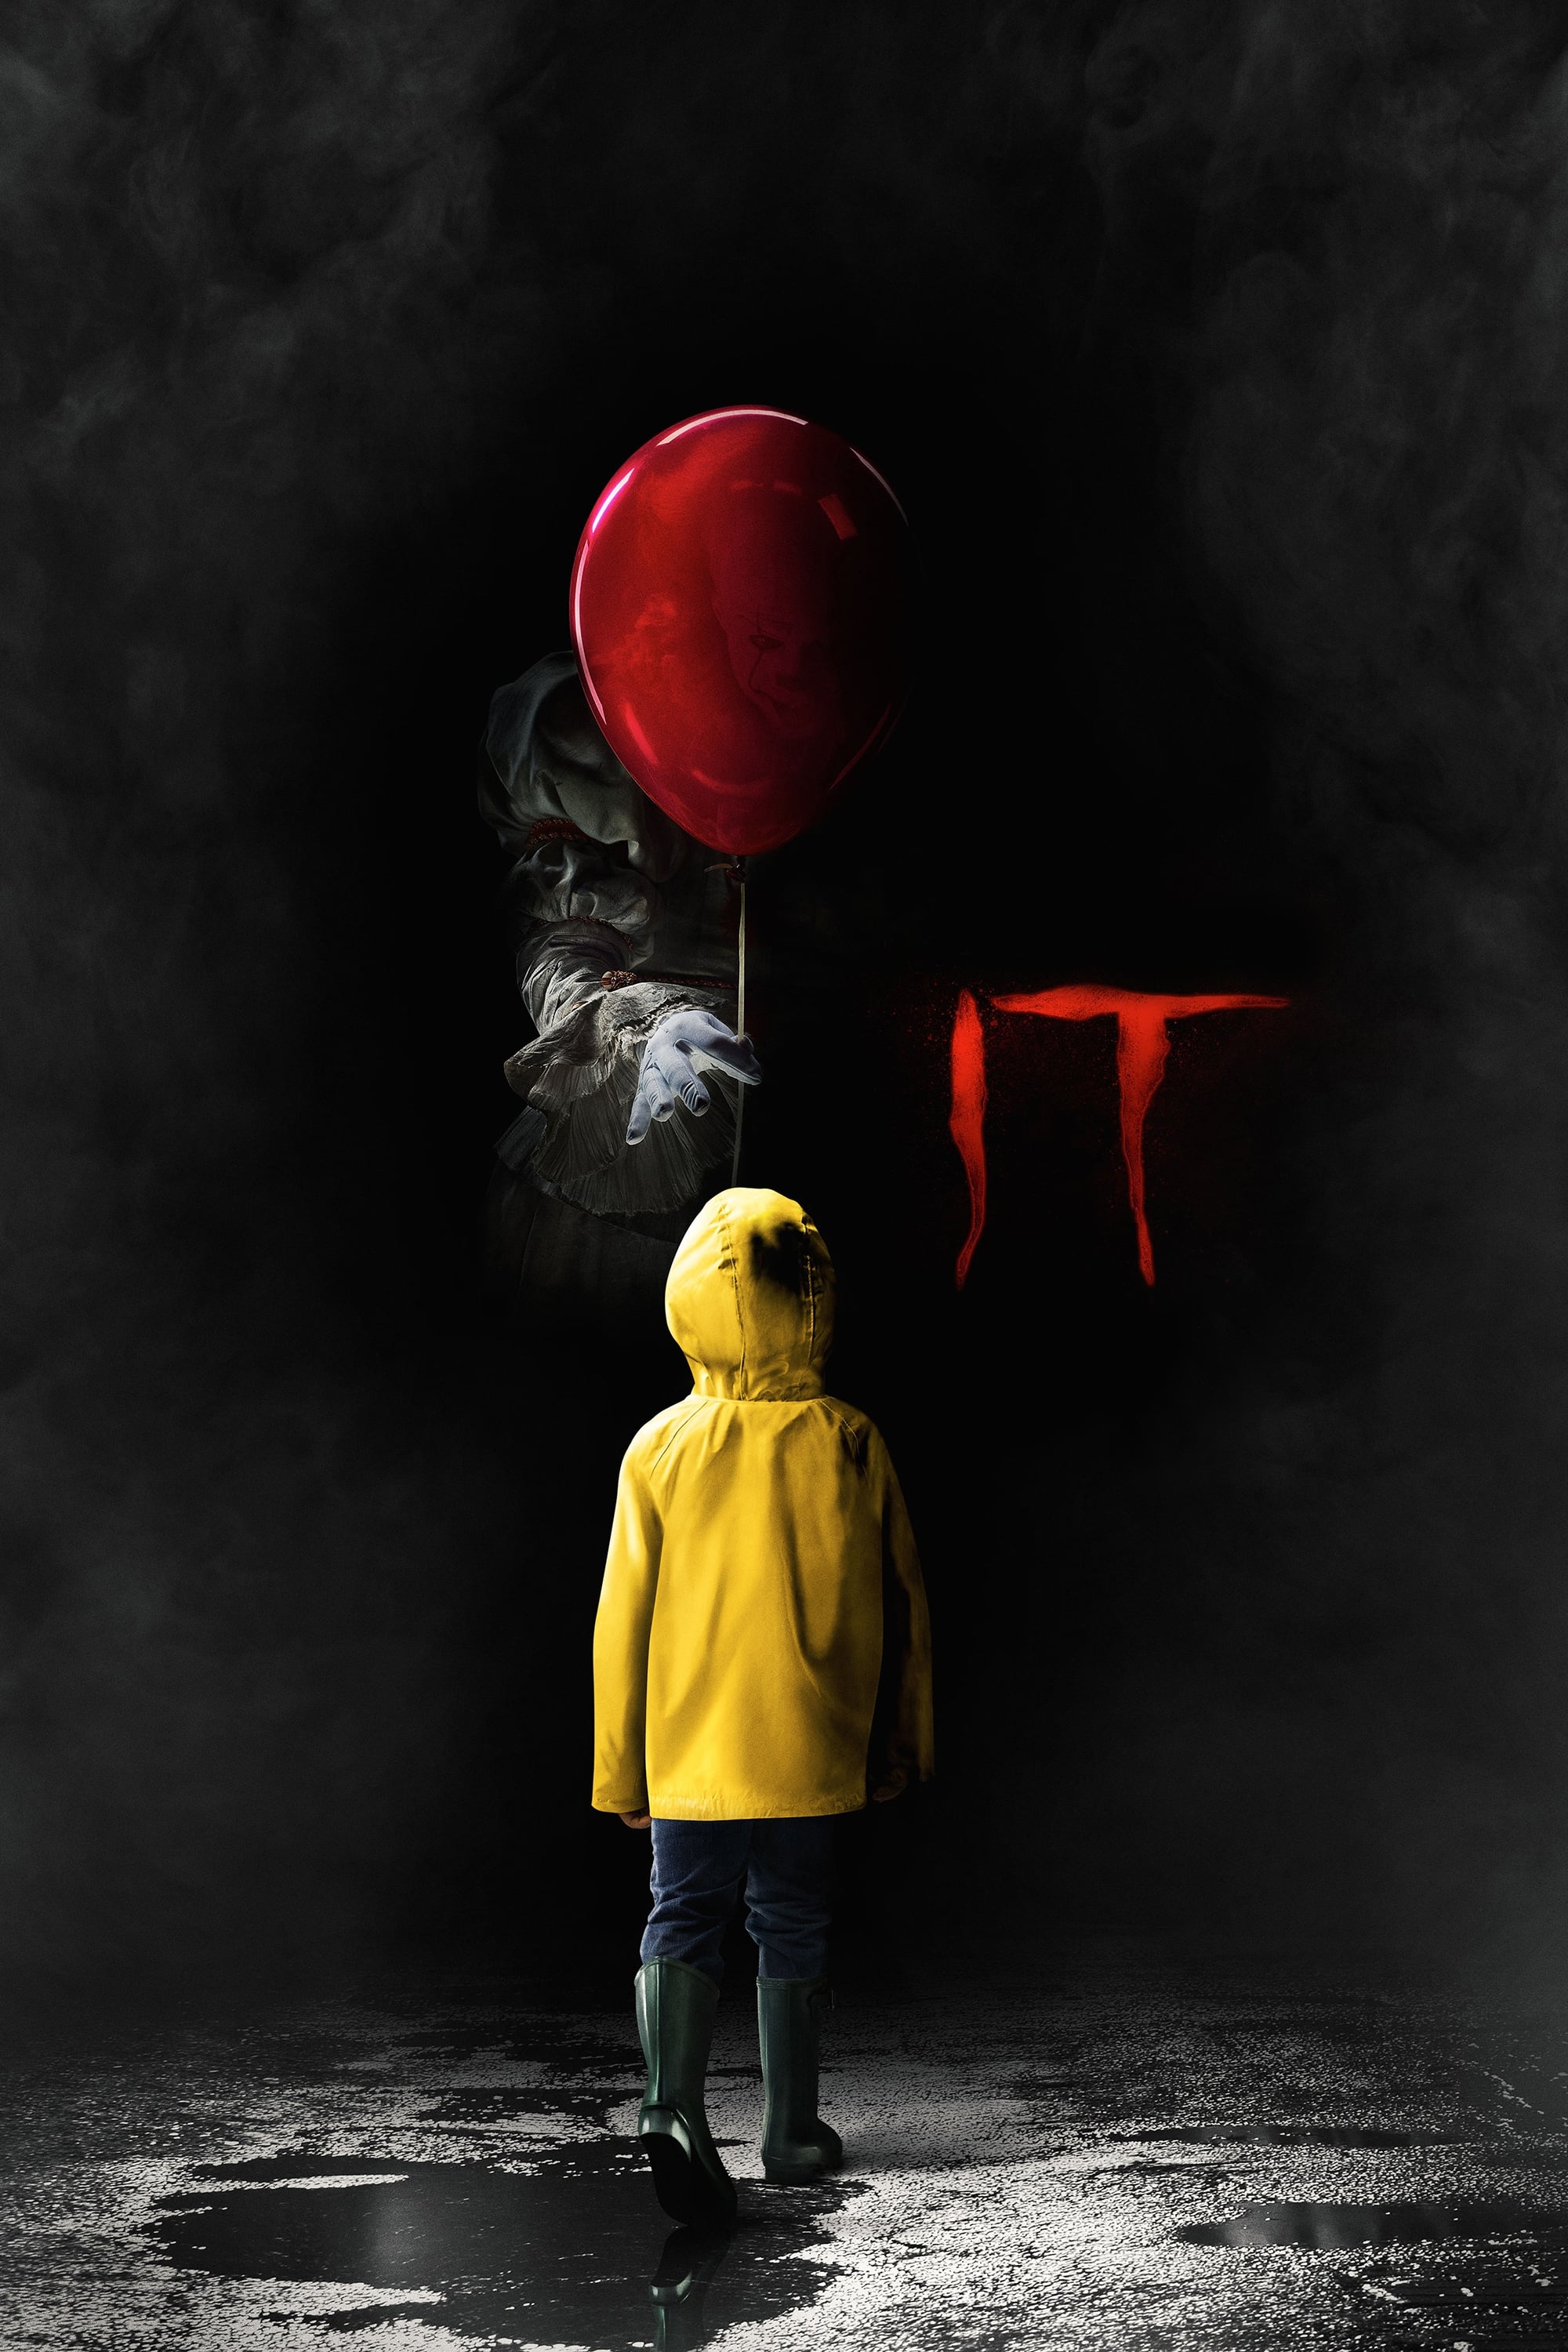
Consider, for example, the 2017 remake of It compared to the 1990 original miniseries. The remake featured a
longer runtime, and a significantly larger budget.
Our approach to this analysis is systematic and data-driven. By using statistical techniques like
distribution comparison and hypothesis testing, we seek to quantify how each variable differs between
originals and remakes.
Image: Original IT and its remake in 1970 and 2017, respectively.
Visualizing and Testing Differences: Aggregate Analysis of Originals vs. Remakes
We apply Kolmogorov-Smirnov (KS) test to determine if two distributions are significantly different. If the
p-value is below 0.05, we conclude that the distributions are significantly different.
Looking at the distributions, we observe notable differences between originals and remakes in terms of star
popularity, vote average, and budget. Specifically, movie remakes generally feature higher star popularity,
lower vote averages, and larger budgets compared to originals.
However, can these differences be solely attributed to whether a movie is an original or a remake? To
address this question, we will conduct a more in-depth analysis in the following sections.
p-value: 0.0234
p-value: 0.0000
p-value: 0.3308
p-value: 0.1770
p-value: 0.2144
p-value: 0.0000
p-value: 0.0000
p-value: 0.2440
p-value: 0.0000
p-value: 0.9945
The Role of Time: Investigating Industry Trends and Their Impact
Since remakes are inherently produced after the originals, it is important to consider the potential impact
of time on the observed differences. Over time, industry trends, audience preferences, and market conditions
may influence key factors such as star popularity, vote average, and budget for movies in general. To
investigate this, we analyze the yearly trends for the average star popularity, vote average, and budget for
all movies (not just remakes and originals). By plotting the mean values of these features over time, we can
assess whether the observed differences between originals and remakes could be partially explained by
broader industry shifts, rather than the nature of remakes alone.
The mean vote average has shown variability over time, with a slight upward trend until the
mid-20th century and a gradual decline in recent decades. This suggests that the lower vote
averages for remakes might align with a general industry trend of declining vote averages
over time, rather than being solely due to the nature of remakes.
Star popularity has steadily increased over the decades,
reflecting the growing prominence and recognition of movie stars in the industry. This trend
indicates that the higher star popularity observed in remakes could be partly due to the
overall increase in star popularity over time, rather than a unique characteristic of
remakes.
Movie budgets have fluctuated significantly over time, with
noticeable peaks in certain periods. However, there is an overall increase in average
budgets in recent decades. The higher budgets observed in remakes may therefore be
influenced by this broader trend of rising production costs in the movie industry.
We will formally test the impact of time on these features using regression analysis on the next slide.
Assessing the Impact of Remakes: A Regression Analysis with Time Controls
To test whether the differences in star popularity, vote average, and budget between originals and remakes
are statistically significant, we perform a regression analysis. Each feature (star popularity, vote
average, and budget) is regressed on the following factors:
1. A dummy variable indicating whether a movie is an original (1 for original, 0 for remake).
2. Decade dummy variables to account for temporal trends over time.
By including the decade controls, we isolate the effect of being a remake or an original while accounting
for broader trends across decades. The focus is on the coefficient of the original dummy variable to
determine if it is statistically significant. This will help us identify whether the observed differences
can be directly attributed to the nature of the movie (original vs. remake) or if they are better explained
by time-based factors.
The regression results provide evidence on the role of originality in explaining the observed differences in
movie features. The key findings are as follows:
Significant Originality Coefficient: Across all three regressions, the coefficient of the "original"
dummy variable is statistically significant (indicated in blue). This suggests that whether a movie is
an original or a remake has a meaningful impact on star popularity, vote average, and budget, even after
controlling for decade-based time trends.
Direction of the Effect: The coefficients for star popularity and budget are negative, indicating that
remakes tend to have higher values for these features compared to originals. In contrast, the
coefficient for vote average is positive, showing that originals tend to have slightly higher vote
averages than remakes. These directions are consistent with the patterns observed in the distributions
earlier, further confirming the differences between originals and remakes in these features.
Note: The coefficients are on normalized features.
Pairwise Analysis of Originals and Their Remakes
Up until now, we compared the overall distributions of features (star popularity, vote average, and
budget)
for originals and remakes as separate groups. As a next step, we shift our focus to a more granular
comparison by analyzing pairs of movies—each original and its corresponding remake. This pairwise
analysis
allows us to directly compare the features of remakes relative to their specific originals, providing
deeper
insights into how these features change when a movie is remade. By examining these pairs, we can better
understand whether the observed trends hold consistently across individual original-remake pairs or are
driven by broader patterns in the data.
Testing for Differences: Mean and Median Analysis
In this analysis, we examine whether the mean and median of the differences between features of original
movies and their remakes are significantly greater or less than zero. To test the mean, we use a one-sample
t-test, and for the median, we apply the Wilcoxon signed-rank test.
Mean and Median are significantly less than zero (p = 0.0002, p = 0.0004).
Mean and Median are significantly less than zero (p = 0.0000).
Mean and Median are NOT significantly different from zero.
Mean and Median are NOT significantly different from zero.
Mean and Median are NOT significantly different from zero.
Mean and Median are significantly greater than zero (p = 0.0000).
Mean is significantly less than zero (p = 0.0110), but median is not.
Mean and Median are significantly less than zero (p = 0.0184, p = 0.0002).
Mean and Median are significantly less than zero.
Mean and Median are NOT significantly different from zero.
The statistical tests reveal significant differences in features like runtime, star popularity, vote
average, adjusted revenue, and adjusted budget. Remakes tend to have longer runtimes, higher star
popularity, and higher adjusted budgets and revenues, while vote averages are higher for originals.
In contrast, features such as director, writer, producer popularity, and sentiment score show no significant
differences. Additionally, vote count shows a significant difference in the mean but not the median,
reflecting variability.
Analyzing Original Features that Influence Remake Features
To understand how original movie features influence remakes, we performed regression analyses on a selected
subset of remake features: runtime, vote average, vote count, adjusted revenue, adjusted budget, and star 1
popularity. Using backward elimination, we identified the most relevant original features impacting each
remake feature. The resulting coefficients reveal key relationships, offering insights into how original
movies shape their remakes.
Rmd. / Org.
Runtime
Vote Ave.
# Vote
Adj. Revenue
Adj. Budget
Star Pop.
Runtime
0.4418
Vote Ave.
0.3580
-0.1440
# Vote
0.1893
Adj. Revenue
0.2765
Adj. Budget
0.2853
-0.3133
Star Pop.
0.3399
Hover on cells to see the p-values.
The regression analysis reveals key relationships between original movie features and their corresponding
remakes. Remake runtime is strongly influenced by the original runtime, indicating that longer originals
lead to longer remakes. Similarly, remake vote average is positively associated with the original vote
average, showing that well-received originals tend to yield well-received remakes. Financially, remake
adjusted revenue is strongly predicted by the original adjusted revenue. Finally, remake star popularity is
strongly tied to the original star popularity, reflecting a continuity in lead actor prominence between
originals and remakes.
Key Insights from Original vs. Remake Analysis
The analysis reveals significant differences between movie originals and their remakes across several
features, influenced by the fact that whether a movie is an original or a remake. Remakes tend to have
higher star popularity, higher adjusted budgets, and lower vote averages compared to originals. We could
interpret this like this: When a movie is good enough, they usually make a remake from it and they usually
use super stars and put big budgets into the remake since they believe it would be very successful.
Furthermore, the regression analysis shows that many remake features, including runtime, vote average,
adjusted revenue, and star popularity, are strongly influenced by corresponding features in their originals.
This suggests that while remakes are shaped by modern industry dynamics, they also carry forward critical
aspects of their originals, such as financial success and audience reception.
What Movie Should I Build From, and How Should I Make It?
When planning a remake, it's crucial to evaluate which past movies are worth remaking and to identify the
key attributes and logistics—such as cast, budget, genre, and more—that should be taken into account. These
factors play a significant role in the success of your remake.
In this analysis, we aim to determine the most important attributes that make a movie a strong candidate for
a remake or that contribute to the success of a remake. To achieve this, we employ regression and causal
analysis to identify the specific attributes associated with remakes.
First, we conduct regression analysis with the outcome variable indicating whether a movie is a remake. From
this, we extract impactful features by examining their p-values under the null hypothesis that the
corresponding regression coefficients are zero. In the second step, we validate the attributes identified
through regression using causal analysis and treatment effect estimation to confirm their significance.
Feature Engineering
Before conducting regression analysis, we performed feature engineering on the dataset. First, we calculated
the maximum popularity of the crew and the average popularity of the top three cast members, as they are the
most influential individuals in the movie. We then identified the most common genres and created dummy
variables for them. Additionally, we incorporated the sentiment score of the movie, its language, and the
country of origin, specifically noting whether it was from the USA. Then, missing values were imputed using
the Datawig library, and each column was filled out based on the others as much as possible.
We also considered the movie's release year and grouped it into intervals. Based on prior regression
analysis, we observed that remakes or movies with remakes were more common before the 1980s, a period
associated with the advent of color television. Budget and revenue were also included, with a new feature
created as the logarithm of the revenue-to-budget ratio. Revenue itself was excluded since we were primarily
interested in its proportional relationship to the budget.
Regression Analysis with All Features
We perform regression analysis on the dataset. We consider two types of regression: considering the features
(columns) to regress one-hot encoding of 1) being a remake or 2) having a remake for each movie. To make the
regressions more interpretable, for the first regression we remove those movies that have remakes and for
the second, we exclude those that are remakes themselves. We then plot the significance of the coefficients
and their confidence intervals. We then try to verify the causal effect of having a remake or being a remake
on the feature that we see their significance. We consider those features as significant if their p-values
are less than 0.05 in the regression. The null hypothesis is that the coefficient is zero.
As we can see, factors such as sentiments, adjusted budget, cast average popularity, genres, and the country of production play critical roles in determining whether a movie is a remake. On the other hand, runtime, vote average, sentiments, adjusted budget, genres, black-and-white status, year and country of production, movie language, and the revenue-to-budget ratio also appear to have significant impacts. Next, we should examine whether these factors have valid relationships with a movie being or having a remake.
Causal Analysis
To assess the impact of being a remake or having a remake on the significance of specific features, we
proceed as follows: for each column, we regress the feature of being a remake or having a remake. Next, we
compute propensity scores and match samples accordingly. We then plot the average treatment effect (ATE) for
the treated and control groups, including 95% confidence intervals. A feature is deemed to have a causal
relationship with being a remake or having a remake if the ATE confidence interval excludes zero and the
corresponding regression coefficient is statistically significant.
Here, treated samples are remakes or movies with remakes, and control samples are the rest. The outcome for
the categorical variable is their value, and for the continuous variable, it is if the value is above the
mean plus two times the standard deviation. This value is chosen to ensure that the feature has a
significant effect on the outcome. We assess the validity of the causal relationship using the bounded odds
ratio (OR). Specifically, we constrain the matched pairs to have an upper bound of 5 for the odds ratio. To
evaluate sensitivity, we plot a histogram of the odds ratios for the matched samples. The causal
relationship is considered valid if the odds ratio is below 4, with the majority of matched samples
exhibiting an odds ratio less than 2.
Let’s Cook!
To conclude, when considering movies that have at least one subsequent remake, the following features showed
a significant causal relationship:
High Vote Average: Movies that receive higher viewer ratings are more likely to inspire a remake. A
possible interpretation is that higher-quality or more critically acclaimed films are deemed valuable
intellectual property worth revisiting or updating for newer audiences.
Being in Specific Genres (Comedy, Thriller, Romance): Certain genres appear more likely to inspire
remakes.
Comedy: Comedies that resonate well with audiences may be remade to align with contemporary
humor, and cultural shifts, or to reach new demographic segments.
Thriller: Thrillers can be easily adapted to modern contexts and technologies, keeping their
suspense elements fresh.
Romance: Romantic films that achieve a timeless emotional resonance may be reinterpreted for new
eras or cultural backdrops.
Black and White Movies: Historically, many black-and-white classics have been remade in color or updated
to reflect modern production values. This suggests that older, iconic films (often black and white)
serve as prime candidates for remaking, potentially due to nostalgia, cinematic legacy, or the desire to
revitalize stories for contemporary audiences.
Made in the USA: U.S.-produced films—given the global prominence of Hollywood—are more likely to be
remade. This may stem from the wide international reach, market potential, and cultural influence of
American cinema.
Made Before 1980: Older films, particularly from before 1980, are more frequently remade. As time
passes, production values, storytelling techniques, and audience expectations shift, making these older
stories appealing targets for modern reinterpretation.
High Log of the Revenue-to-Budget Ratio: Films that proved financially successful relative to their
production costs are likely to catch the attention of filmmakers and studios looking for profitable
properties to revisit. This financial indicator suggests that the perceived commercial viability drives
the decision to invest in a remake.
For movies that are themselves remakes of earlier works, the following features have a significant causal
relationship:
Negative Sentiment: Remakes tend to arise even when the original film has a negative sentiment.
Filmmakers might see an opportunity to reinterpret or enhance the emotional resonance of a sad or somber
story to better connect with modern audiences or have deeper feelings in the movie.
High Budget: Modern remakes are often given higher budgets, possibly to leverage updated technology,
special effects, or star power. Studios may feel more confident investing heavily in known intellectual
property, anticipating stronger box-office returns due to brand recognition.
High Average Popularity of the First Three Cast Members: Remakes often get well-known or rising star
actors to generate publicity and attract audiences. Casting high-profile talent can rekindle interest in
a familiar story and differentiate the remake from its predecessor.
Being in Specific Genres (Thriller, Romance): Similar to the pattern seen for having a remake, certain
genres—thrillers and romances—are common subjects of remakes. These genres rely on timeless emotional or
suspenseful narratives, making them ripe for re-interpretation and modernization.
Made in the USA: The U.S. film industry’s influence is again evident. Remakes are frequently developed
within Hollywood, likely due to the robust infrastructure, global distribution networks, and a history
of successful adaptations.
The analysis suggests that certain film characteristics are causally linked to the likelihood of a movie
having a remake or being a remake. Films that are older, successful, and produced in the U.S., and that
belong to certain genres, appear more likely to inspire future remakes. For movies that are themselves
remakes, factors like higher budgets, star-studded casts, and fitting into “remake-friendly” genres are
associated with their production. They are mostly made by the US movie industry and they mostly have
negative sentiments, probably to have deeper feelings about the movie. Additionally, the sensitivity checks
reinforce the credibility of these findings, indicating that these relationships are robust to concerns
about potential unobserved confounders.
Deja View: Uncovering the Patterns Behind Movie Remakes
So, here’s the short answer to that big question: “Which classic should I remake, and will it be a smash?” Our data-driven deep dive shows that remakes aren’t just luck of the draw or a spur-of-the-moment decision. They’re guided by some pretty clear markers. Older hits—especially black-and-white classics produced in the U.S.—carry the kind of nostalgic pull and proven track record that make them prime remake material. Throw in genres like Comedy, Thriller, or Romance for that timeless appeal, and you’ve got audiences ready to fall in love (or scream in terror) all over again.
On the production side, it’s all about turning up the heat: bigger budgets, star-studded casts, and a willingness to reinvent a story—even when the original is heavy on negative sentiment. Why negative? Because a sad or dark plot can be turned into a fresh emotional roller coaster that resonates with modern viewers. And yes, producers often bet on films that already proved their ability to recoup costs, hence the high revenue-to-budget ratio factor.
For you—the director at “Lausanne Pictures” who’s itching for a brilliant comeback—this analysis is practically a script for success. By zooming in on an older, fan-favorite movie with strong genre appeal, doubling down on star power, and harnessing the modern filmmaking arsenal (think immersive technology and jaw-dropping VFX), you can create a remake that isn’t just another reboot, but a blockbuster with its own identity. In other words, the perfect fusion of a classic legacy and today’s big-screen magic. Ready to roll? Lights, camera… remake!
We acknowledge using ChatGPT model to generate fictional images for this data story.